Mining Calculator
Pick a miner, enter your electricity cost and see what you would earn today, when you break even and how your profit grows over two years.
Profitability calculator
Miner
Number of Miners
Miner Price
Electricity Rate
Pool Fee
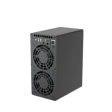
Goldshell KA Box
Profit
-$0.79
per day, after electricity and pool fees
Daily Metrics
- Revenue
- $0.18
- Power Cost
- $0.96
- Pool Fee
- $0.00
- Power Usage
- 9.60 kWh
- Minimum Price
- $0.1692
- KAS/Day
- 5.67
Projected Earnings
- Monthly Profit
- -$23.60
- Yearly Profit
- -$287.10
- Initial Investment
- $0.00
- Days Until ROI
- ∞
- KAS/Month
- 170.22
- KAS/Year
- 2,070.98
Profitability Projection
Understanding the calculator
Introduction
This mining profitability calculator helps you evaluate potential returns from Kaspa (KAS) mining operations. It provides detailed projections based on real-time network conditions and your mining configuration.
How It Works
The calculator analyzes current network data along with your equipment and operational costs to estimate potential mining profitability. It considers factors such as electricity costs, mining rewards, and pool fees to provide comprehensive financial projections.
Input Parameters
- Miner
- Select from popular ASIC miners like Iceriver KS5L, KS2 Lite, KS0 Ultra, or Goldshell KA Box
- Number of Miners
- Set the quantity of mining units you plan to operate
- Miner Price
- Cost of each mining unit in USD
- Electricity Rate
- Input your electricity rate in USD per kilowatt-hour (kWh)
- Pool Fee
- Set your mining pool's fee percentage
Calculated Metrics
- Power Usage
- Daily electricity consumption of your mining setup
- Minimum Price
- Minimum KAS price needed to break even
- Power Cost
- Daily cost of electricity based on your power rate
- Revenue
- Daily mining revenue before costs
- Pool Fee
- Daily mining pool fees
- Profit
- Daily profit after power costs and pool fees
- Initial Investment
- Total amount invested in mining hardware
- Monthly Profit
- Estimated monthly profit based on current conditions
- Yearly Profit
- Estimated yearly profit based on current conditions
- Days Until ROI
- Number of days until investment is recovered
- KAS/Day
- Estimated number of KAS mined per day
- KAS/Month
- Estimated number of KAS mined per month
- KAS/Year
- Estimated number of KAS mined per year
Projections
View interactive charts showing cumulative profit, revenue, and cost projections over 6-month, 1-year, and 2-year periods. The break-even point is clearly marked when your cumulative profit equals the initial investment.
Important Notes
- Calculations reflect current network conditions and may vary over time
- Projections assume stable network difficulty and KAS price
- Additional costs like cooling, maintenance, and hosting are not included
- Actual results may differ due to market conditions and network changes
- Consider hardware depreciation and upgrade cycles in your planning